
The latest exclusion figures Part 3
In the 2022/23 academic year, permanent exclusions from schools in England were noticeably higher than in the years before the pandemic. But this is only true for some categories of pupil.
The story so far
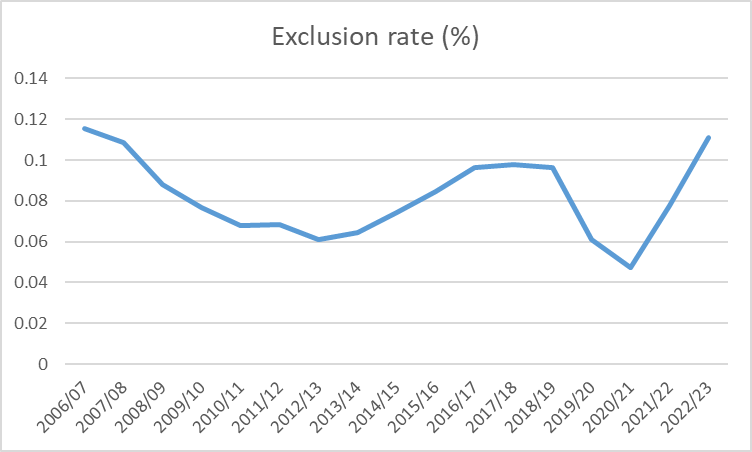
In Part 1, I observed that permanent exclusions from schools in England, in the academic year 2022/23, had risen to a level much higher than before the pandemic.

I suggested that we would need to look at what had happened to exclusion rates in particular demographic groups before we could look for reasons why exclusions had risen so dramatically.
In part 2, I showed that the main contributor to the high level of exclusions was in Key Stage 31, where exclusions had risen to an unprecedented level.
Many of the interesting patterns in the exclusion figures are the same every year. Boys, FSM pupils2, and secondary school pupils are over-represented in the data. London and the South East have very low exclusion rates.3 A lot of discussion centres around SEND4 and exclusions. However, I will leave that for now, as the exclusion rate for SEND is frequently misunderstood.5
What is more interesting than the long-established pattern of exclusions is the extent to which the patterns seem to have changed. In this third and final post, I will look at whether ethnicity and gender have played a role in the increase in exclusions, and we will see that two large population groups have contributed disproportionately to the high exclusion rates in 2022/23.
Ethnicity and the rise in exclusions
Education pundits often seem convinced that ethnicity and race are important in exclusions.
According to a BBC article about the 2022/23 exclusion figures:
There was also an over-representation of pupils from black or mixed white and black backgrounds.
This is incorrect. There is no category of “mixed white and black backgrounds”. 6 As far as black pupils are concerned, the only notable thing is that the gap between black pupils (who have a below-average exclusion rate) and white British pupils (who have an above-average exclusion rate) has widened further. I still hear it claimed that black pupils are more likely to be excluded. This used to be true, but it has not been the case for a few years.7

Previously, there had been a figure published for all ethnic minority pupils. This now seems to have been removed from the data8.
I’ve calculated this myself.9

We can see that exclusions seem to have risen particularly among white British pupils.
The most surprising part of the data
The other interesting change in exclusions was very unexpected. The exclusion rate for girls, which is always much lower than for boys, was unusually high in 2022/23.
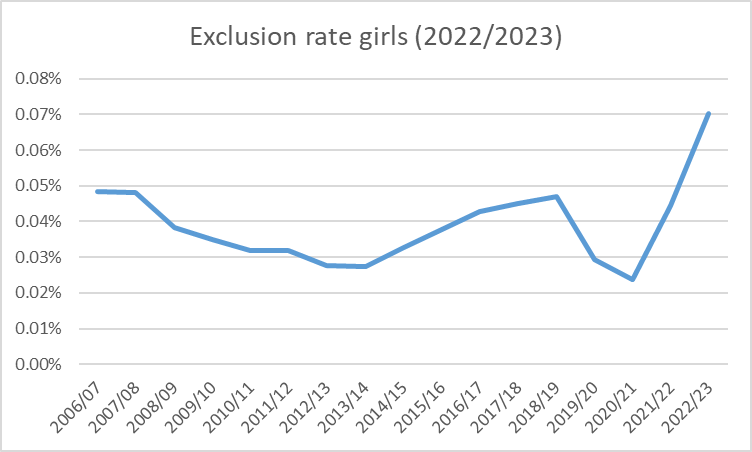
The exclusion rate for boys was still much higher than for girls, but far less surprising. It is only marginally higher than before the pandemic.

The dramatic change in exclusions of girls can also be seen in the raw numbers. In 2022/23, exclusions overall were about 1500 higher than the recent peak in 2017/18. However, exclusions of boys were up by less than 400 since 2017/18. Exclusions of girls were up by 110010 since 2017/18. 2895 girls were excluded in 2022/23, which is over 1000 more than in any previous year for which I have data. This is an extraordinary change; compared with any of those other years, the number of girls excluded is more than 50% higher.
When I discussed the rise in exclusions among Key Stage 3 pupils in Part 2, I was able to suggest reasons why pupils in this age group might be driving the increase in exclusions. I don’t have any suggestions as to why the increase in exclusions might be disproportionately affecting white British pupils or girls. If you have any ideas, please don’t hesitate to use the comments on this post (which I will open to all subscribers) to make suggestions.
Pupils aged 11-14.
Eligibility for Free School Meals (FSM) is often used as a measure of disadvantage.
Despite this, pundits, activists and politicians often claim that knife crime in London is driven by exclusions.
Special Educational Needs and Disabilities.
Details of how the exclusion rate for SEND pupils can be misleading can be found in this post, looking at figures from 2021/22:

There is “mixed white and black Caribbean”, which is one of several small groups that consistently have a higher exclusion rate than white British pupils. There is “mixed white and black African”, which usually has an exclusion rate about the same as white British pupils. All other mixed white and black pupils would be included in the generic (and useless) category of “Any other mixed background”.
In 2022/23 the exclusion rates for these groups were:
White British 0.13%
Mixed white and black Caribbean 0.24%
Mixed white and black African 0.14%
Any other mixed background 0.10%
Possibly because much of the historical data used in the previous release was incorrect.
‘To be fair, the peak for girls’ exclusions was 2018/19, not 2017/18. But even compared to that year, girls’ exclusions increased by over 1000.
Hello Andrew,
Before I give you any suggestions behind why exclusion rates for girls unusually increased during the 2022-2023 school year, I'd like to say a big thank you for your excellent eye-opening blog. The amount of time and hard work you have put into your Education Battleground blog is outstanding, to say the least, and what makes them so engaging is the amount of knowledge you possess not just about education, but also other subjects, and using that knowledge to challenge the myriad of myths that the British education system has been plagued by. It's your detailed wealth of knowledge that makes you posts so readable and engaging that I knew it's worth paying for subscription to your Substack blog. One post from your Wordpress blog that still makes me chuckle is the "Charlie and the Inclusive Chocolate Factory" satire your wrote, showing that also a bit of common sense is needed to discredit so many myths about education, behaviour and achievement in children. Please keep up the amazing work and I look forward to more posts!
And now back to the topic at hand. My suggestion behind high female exclusion rates may partly be explained through social media. I have noticed that TikTok in particular has a very large young female audience thanks to the large presence and quantity of female influences. Many teenage girls begin to look up to them and start copying their antisocial actions in order to establish an identity among their peers, which never leads to a positive outcome. It's also worth noting that such girls tend to be very sneaky and vengeful via cyber-bullying towards their peers. In other words, TikTok bullying could led to their exclusion. On the other hand, it's been 5 years since TikTok rose in popularity, so we cannot couldn't consider this alone as the largest explanation, but it certainly is a factor.