
The latest exclusion figures Part 1
We can breathe a sigh of relief. The new government listened to common sense on the issue of exclusions.

The story so far
In my most recent free blog post1, I discussed the (then) imminent release of the permanent exclusion figures for England’s schools, covering the academic year 2022/23.

On Thursday, England's teaching profession will learn whose side the new education ministers are on
I predicted that, when the figures were released, they would show a very high number of permanent exclusions2. My main concern was that the increase might prompt calls for the government to limit the power of schools to exclude.
I wrote:
This debate [the debate about exclusions that follows the release of the figures] will probably tell us whether the newly appointed education ministers are on the side of teachers and pupils (who need schools to be safe), or the side of the traditional education establishment (who want to reduce exclusions at all costs). While it would be ridiculously optimistic to expect ministers not to use the figures to attack the last government, there is more than one way they can respond. If ministers say they will make it harder to exclude, or claim that schools have done too little to prevent exclusion, we can expect the worst.
Now for some good news
It was reported3 that:
Stephen Morgan, the education minister, said: “These shocking figures4 are a wake-up call about the problems that have grown in our schools in recent years. They put into sharp focus that too many pupils are being held back by their background and that our education system is failing to meet the needs of children with additional needs.
“Every pupil deserves to learn in a safe, calm classroom and we will always support our hard-working and dedicated teachers to make this happen.”
He added that Labour had committed to providing access to specialist mental health professionals in every secondary school, introducing free breakfast clubs in every primary school and ensuring earlier intervention in mainstream schools for pupils with special needs.
“But we know poor behaviour can also be rooted in wider issues, which is why the government is developing an ambitious strategy to reduce child poverty led by a taskforce co-chaired by the education secretary so that we can break down the barriers to opportunity,” he said.
While I am extremely sceptical that the policies he mentioned will have much effect on permanent exclusions, this response included no threat to restrict school leaders' power to exclude. A few days later, the Secretary of State for education was even more reassuring when interviewed on LBC5:
…a Labour government expects high standards where it comes to behaviour within our schools. We know that in order for children to learn they have to be in calm, orderly environments where they get the support that they need from our teachers and school leaders and I back school leaders and the tough choices that they sometimes have to make…
… School leaders should retain that important step. It's not something they do lightly because they know the consequences. But there are consequences of not acting. I completely understand the disruption that can be caused to the wider school community.
I am delighted that education ministers have backed schools. We only have to look at Scotland to see the results of making it hard for schools to exclude6.
Has there been a record number of exclusions?
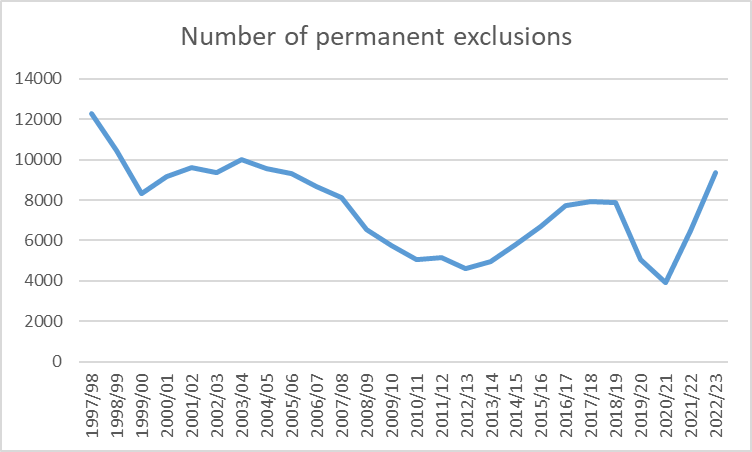
There were 9376 exclusions in the 2022/23 academic year. This represents 0.11% of pupils. This is higher than the rate before the pandemic, but not as high as 2006/77.
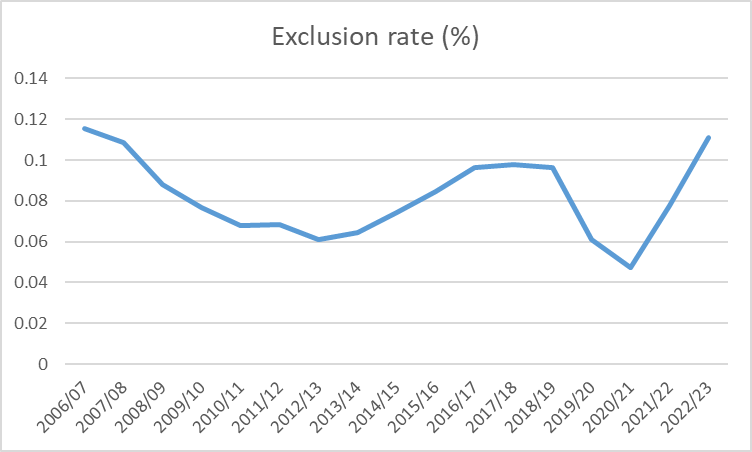
The current year is the highest recorded annual number of permanent exclusions. Although permanent exclusions were relatively stable before the pandemic, the longer time trend over the past 10 years has been a gradual increase.
The second part of this (i.e. the claim that the trend is a gradual increase) seems a little misleading. 10 years earlier was a record low point, so why measure the trend from there? Also, is growth, then stability, then a collapse, then growth again really a trend? People’s willingness to identify a trend from limited or inconsistent data often reveals their own biases, and I wonder who wrote this.
Worse, the first part (i.e. the claim that 2022/23 is “the highest recorded annual number of permanent exclusions”) seems to be wrong. It is true that if you look at the raw numbers, 2022/23 is higher than every year from 2006/7 onwards. This is because the school population has grown, so even though the exclusion rate was higher in 2006/7, the number of exclusions was lower. However, older data is available9 and it includes 5 years with a higher number of permanent exclusions than 2022/23.
This older data is sometimes considered not comparable with the data from 2006/7 onwards because of changes in methodology. However, this is because the data from those years may have undercounted the number of permanent exclusions10. This is not a good reason to ignore it in this context.
Why have exclusions increased?
I hope it is clear from this discussion that the increase in exclusions is partly due to:
A greater number of pupils;
The end of the period of lower exclusions that began with the first lockdown.
I would add to this the fact that secondary schools (where most exclusions occur) now have a larger proportion of pupils than they did before the pandemic.
While I would say that these three points explain why exclusions are no longer lower than before the pandemic, they are insufficient to explain why exclusions are even higher than before the Covid lockdowns. To have any hope of understanding this, we need to break down the data and see which demographic groups have an exclusion rate above pre-pandemic levels. There are surprises in the data, and I will look at these in Part 2.
Sorry for the lack of posts lately. The end of term was overwhelming; the start of the holidays was hard to adjust to, and then I was ill.
This was not difficult to predict, as the autumn and spring term figures had already been released.
I have copied this from the Guardian’s article on the figures, as it was the best of those I read. Stephen Morgan is quoted saying the same words in other articles, so I assume this came from a press release.
In context, he was probably referring to the suspension figures, as well as the permanent exclusion figures. I am only interested in permanent exclusions, as I think suspension figures are a bit too easy to manipulate to tell us anything interesting.
More details of that interview, and the reasons why the Secretary of State was discussing the issue, can be found in this post for paid subscribers:

I wrote about Scotland’s lack of exclusions back in 2020. Much about the behaviour crisis in Scottish schools has been written since then.
Department for Education.
If I have understood the data correctly, for some of these years, it’s the suspension figures, rather than the permanent exclusion figures, that are not comparable.
I probably should have explained why some of the data from before 2006/7 might be an undercount. More information can be found in the link below, but the key point is that CTCs and academies did not return information on permanent exclusions until 2000/01. There are even bigger problems for suspension data, which doesn't affect what I am looking at, but does mean that the DfE has a reason to start their data after those issues were resolved. https://assets.publishing.service.gov.uk/media/5a7c546ded915d338141e190/sfr22-2010.pdf