
The latest exclusion figures Part 2
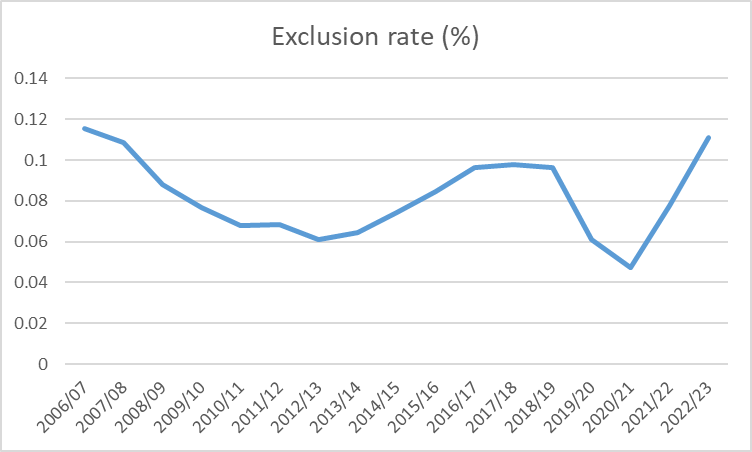
In the 2022/23 academic year, permanent exclusions from schools in England were noticeably higher than in the years before the pandemic. But this is only true for some categories of pupil.
The story so far
In my last post, I observed that permanent exclusions in the academic year 2022/23 had risen to a level much higher than before the pandemic.

I suggested that we would need to look at what had happened to exclusion rates in particular demographic groups before we could hope to understand why exclusions had risen so much.
Age groups matter when looking at the increase in the exclusion rate
The increase in exclusions, to levels much higher than before the pandemic, was not evenly distributed among age groups. In primary schools,1 the exclusion rate was only marginally higher than immediately before the lockdown, and was lower than in 2016/17.
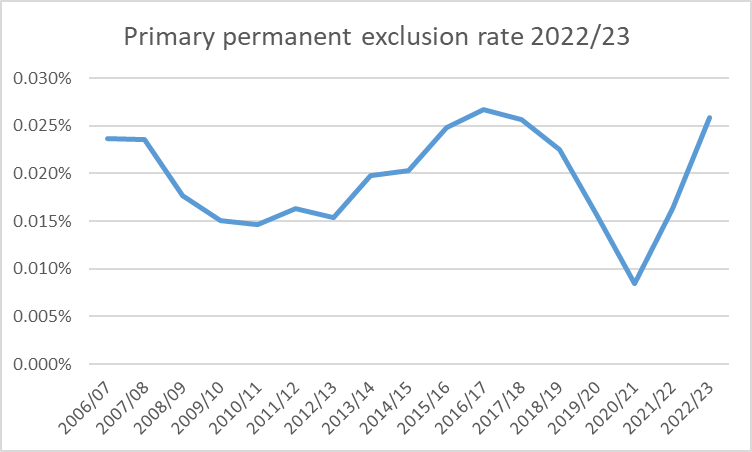
Anyone trying to explain why exclusions were higher than before the pandemic must avoid pointing too much to factors, such as poverty, that would have affected primary schools.
In secondary schools, exclusions in 2022/23 were well above the rate in the years before the pandemic.2
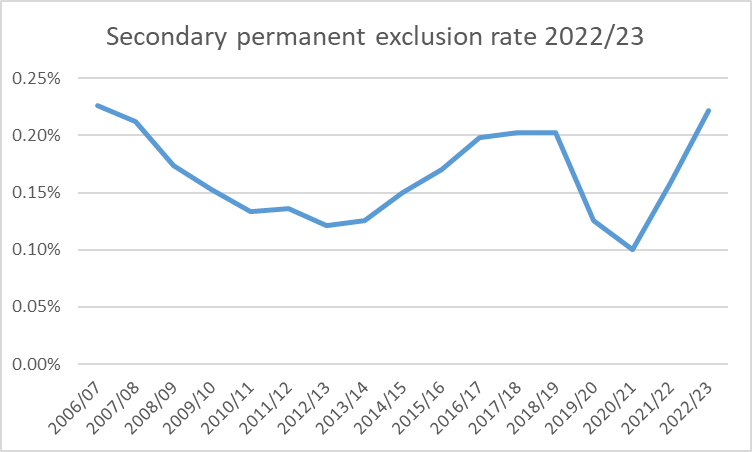
Secondary schools always account for the vast majority of exclusions. The secondary school population has grown in recent years, which will also have increased the overall number of exclusions.
However, within secondary schools, the increase was not evenly distributed among the year groups.3 Year 11 in 2022/2023,4 had a lower exclusion rate than Year 11 cohorts in the years before the pandemic.
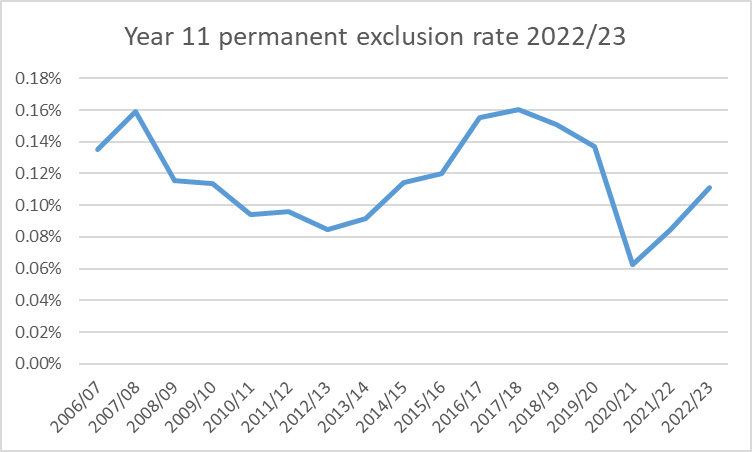
Year 10 in 2022/23, had about the same level of exclusions as the Year 10 cohorts before the pandemic.
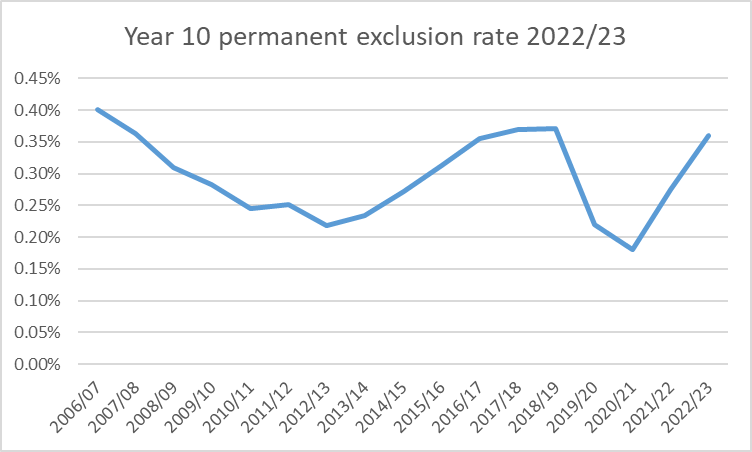
This is surprising, as Year 10 always has the highest rate of permanent exclusions. Also, these were pupils who had their first two years in secondary school interrupted by the pandemic. However, in 2022/23, Year 10 did not contribute to pushing exclusions above pre-pandemic levels.
It is the Key Stage 3 year groups,5 which drove the increase in exclusions.
The rise in Key Stage 3 exclusions
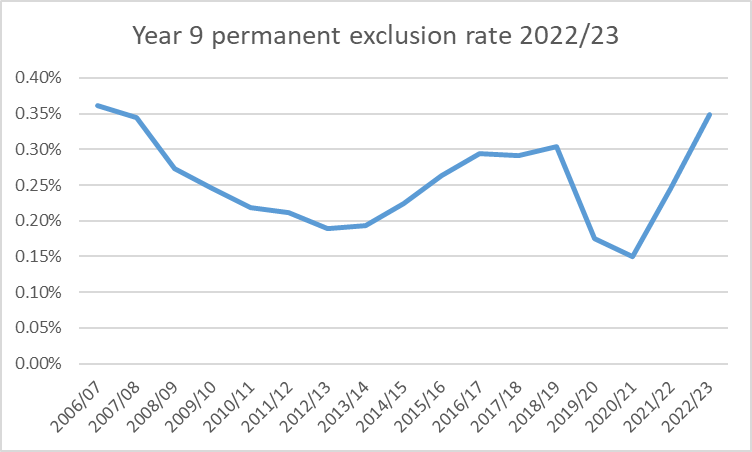
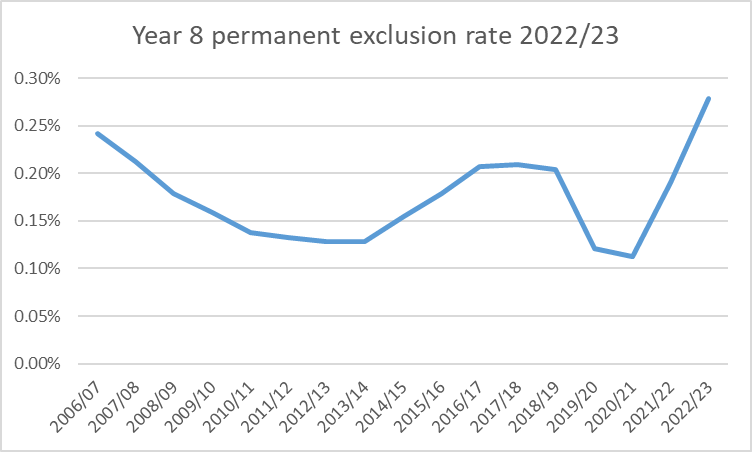
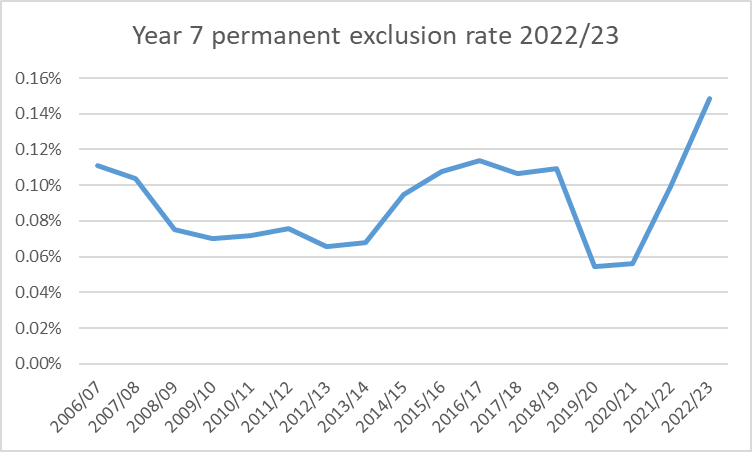
All three Key Stage 3 year groups are above pre-pandemic levels, and Years 7 and 8 have the highest exclusion rates ever recorded for those year groups.6 Whatever is driving exclusions above pre-pandemic levels seems to be something that has only affected Key Stage 3.
The most likely reason for the different impacts on different year groups is the pandemic. The effects of the lockdowns are likely to vary, depending on which year group children were in when they experienced them. Years 7, 8 and 9 in 2022/23 experienced the first lockdown in Years 4, 5 and 6 (respectively) of primary school. They experienced the second lockdown in Years 5 and 6 of primary and Year 7 of secondary. In my previous post, I had speculated that disruption of the transition to secondary school might have the greatest effect on behaviour. This appears to have been incorrect. The impact on exclusions seems to have been greatest for those pupils whose final years of primary school were disrupted by lockdowns.
I probably don’t need to remind you that correlation is not causation. If I knew of other factors that might have affected these year groups, I might be less willing to assume that disruption towards the end of primary school was the cause. It should also be noted that even if it was this disruption to the last years of primary school which has driven up exclusions in the first years of secondary school, we don’t know what the mechanism was. The pattern of primary school exclusions might give us a clue. Generally, the rate of permanent exclusions rises from Year 2 to Year 5. Whether Year 6 has more exclusions than Year 5 seems to vary from year to year. Therefore, the year groups with the highest exclusion rates in 2022/23 are those who experienced lockdowns at an age where the risk of exclusion from primary school was highest. It is likely the pandemic disrupted behaviour interventions (including exclusions) in the final years of primary. Perhaps Years 4-6 of primary school are critical in ensuring good behaviour in secondary school.
Even if this speculation is incorrect, I would point out that I have not read any analysis of the increase in exclusions to above pre-pandemic levels that mentions it was driven by Key Stage 3. For this reason, I have not seen anyone trying to explain it. Please feel free to make suggestions in the comments if you think you know why Key Stage 3 in 2022/23 had such a high rate of exclusions.
In part 3, I will look at whether race and sex have affected the rise in exclusions.
In England’s education system, the last year of primary school is for pupils aged 10-11, and the first year of secondary is for pupils aged 11-12.
Year 11 pupils are aged 15-16. This is the final year of secondary school, and a major transition point in the English education system. Year 10 are aged 14-15. Year 9 are aged 13-14. Year 8 are aged 12-13. Year 7 are aged 11-12.
Year groups in England are divided into Key Stages. Years 7, 8 and 9 are Key Stage 3. Years 10 and 11 are Key Stage 4.
I can only find raw numbers from before 2006/7, so comparison is not possible in this case.