


UPDATED POST: Exclusions, ethnicity and disadvantage
Disparities in exclusion rates between ethnic groups have more to do with disadvantage than racism.

I wrote the original version of this post in July 2023 using data from the 2020/21 academic year. Since then, two more years of data have been published. Following the response to a Freedom of Information request, I can now update the post with the data from 2022/23.1
In 2022, I looked in detail at the data on exclusions and ethnicity.
Why do some ethnic groups have higher exclusion rates? Part 1
Why do some ethnic groups have higher exclusion rates? Part 2
I found that while there was a time when ethnic minority pupils were more likely to be excluded than white British pupils, ethnic minority pupils have had a noticeably lower exclusion rate since 2014/15. Very recently, I noticed that the DfE data this was based on was incorrect, overstating the exclusion rate for ethnic minority pupils for some years.2 In reality, the exclusion rate for pupils who are not white British has been lower than for those who are since at least the mid-00s, probably longer. However, for many years, the exclusion rate for black pupils was higher than for white British pupils. The gap closed in 2019/20 following years of falling exclusions for black pupils. The media continued to claim otherwise. The exclusion rate for black pupils is now considerably lower than for white pupils3.
If you slice the data up more finely, there are ethnic groups with a consistently higher exclusion rate than white British pupils. The following groups have had a higher exclusion rate than white British pupils every year for five years:4
Black Caribbean
Gypsy Roma
Traveller of Irish heritage
Mixed – White and Black Caribbean5
However, far from being representative of ethnic minorities, less than 9% of ethnic minority pupils come from these groups6. With so few pupils in these four categories, and so few ethnic minority pupils excluded overall, we should avoid assuming that the factors causing the disparities for these four groups are relevant to all ethnic minority pupils. Nor should we assume that the factors affecting the exclusion rate for a specific ethnic group are relevant to all pupils in that ethnic group. Also, we should not assume that the effects of these factors are system-wide. Anyone who draws conclusions about the education system as a whole from the exclusion figures for those four groups is likely to be cherry-picking.
Much of the media coverage of exclusions focuses on differences between black and white pupils. However, there is some variety in the four groups identified above. Two of these groups are classified as white; one is classified as black, and one as mixed race. They do have two things in common:
they are relatively small groups (ranging from 6,829 Irish traveller pupils to 132,021 mixed white and black Caribbean pupils);
they are more disadvantaged. Whereas 23% of white British pupils qualify for Free School Meals7, these four groups range from 43% on FSM (black Caribbean) to 65% on FSM (traveller of Irish heritage). They have the four highest FSM percentages out of the eighteen ethnic groups.8
The fact that these four groups have very high FSM rates strongly suggests the possibility that racial disparities in exclusion rates are, in fact, disparities based on poverty. This is where we come up against the limitations of the data. It is very difficult to assess the level of disadvantage of these pupils. We do not know the level of income or wealth of parents. The percentage of FSM pupils is generally considered effective at an aggregate level (i.e. identifying schools or demographic groups with a high level of disadvantage) but less accurate at an individual level. When looking at ethnic groups, there is no guarantee that, for a given level of poverty, all ethnic groups are equally likely to claim Free School Meals. And even if we could be sure that FSM pupils from different ethnic groups had similar levels of disadvantage, it is extremely unlikely that non-FSM pupils would be comparable9. We would expect the non-FSM pupils in some ethnic groups to be from far wealthier backgrounds, and to come from higher-earning households, compared with the non-FSM pupils in some other ethnic groups10. I suspect the one set of figures that might be most useful in taking account of disadvantage when looking at the exclusion rates for different ethnic groups, is the exclusion figures for FSM pupils.
Unfortunately, these figures are not published, however, I made a Freedom of Information request for them. Using these data, I compared white British pupils on FSM with the four groups that consistently had higher exclusion rates than white British pupils. Only Gypsy Roma pupils were at greater risk of exclusion than white British pupils on FSM.
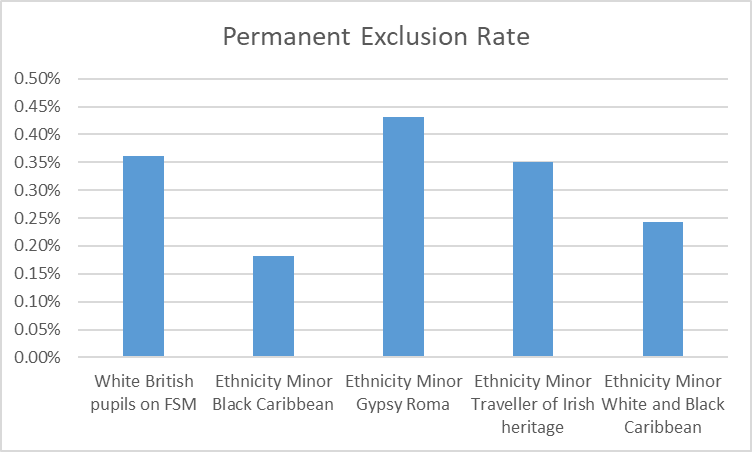
There are 1,205,544 white British pupils on FSM, whereas there are only 28,068 gypsy Roma pupils (and only 247,372 pupils in all four “high-risk” ethnic groups combined). If the reason for looking at exclusion rates and ethnicity was to identify pupils at the greatest risk of exclusion, then looking at white British FSM pupils would be more useful than looking at ethnicity.
Of course, if the reason for looking at exclusion rates and ethnicity is to identify evidence of unfairness, or racism, then this would not be the appropriate comparison. It would be more appropriate to look at FSM pupils in each of the four high-risk groups. In the 2022/23 figures for FSM pupils, one of those groups (black Caribbean FSM pupils) had a lower rate of exclusions than white British FSM pupils.
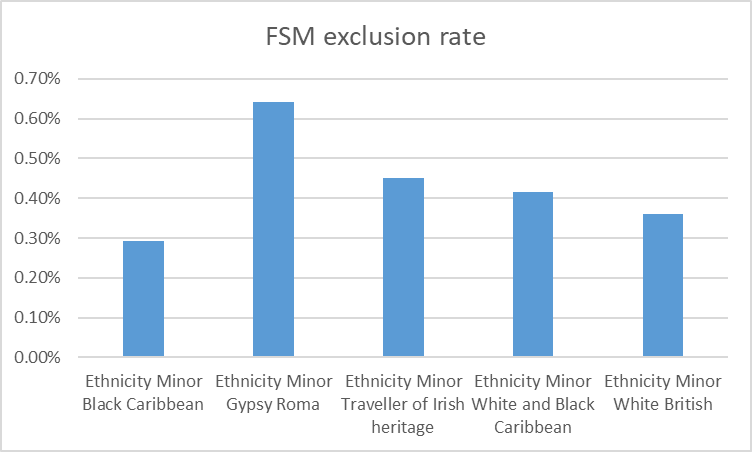
This will probably come as a surprise to anyone who has seen the emphasis on black Caribbean pupils in campaigning against exclusions. Much of this campaigning claims that a black Caribbean boy on FSM is at huge risk of permanent exclusion. However, a white British boy on FSM was 24% more likely to be excluded in 2022/23.
For some, race and ethnicity will always be the most important factor when considering exclusions. Questions remain as to why gypsy Roma, Irish Traveller, and mixed white and black Caribbean pupils have such high exclusion rates. There are also questions about why there are such large differences in FSM rates between different ethnic groups. However, differences in exclusion rates due to ethnicity increase the risk of exclusion for remarkably few ethnic minority pupils. The big question should be why, on average, being from an ethnic minority reduces the risk of exclusion. Moreover, the focus on race and ethnicity may have distracted us from the much bigger influence of disadvantage.
I have rewritten the old post so that this post reads as a contemporary post. For instance, I have replaced “Last year” with “In 2022” and when I say “very recently” that refers to 2024 and is something that wasn’t in the original post.
If you look at the data here, you’ll see that from 2016-2021, if you add up the number of white British pupils, ethnic minority pupils and pupils whose ethnicity is unclassified, you get the entire pupil population. This is also the case for 2011/12. However, in other years, there are almost a million pupils who aren’t in those three categories. It suggests an inconsistent definition of ethnic minority has been used. The ethnic minority category was removed in 2022/23, and I discovered the error when trying to calculate the exclusion rate for all ethnic minority pupils, for this post:

Details can be found in the blog post linked to in footnote 2.
The original version of this post (based on 2020/21 figures) included the category “Any other black background” (i.e. all black pupils who were not classed as either black Caribbean or black African). However, this group had a lower exclusion rate than white British pupils in 2022/23.
The proportion of pupils eligible for Free School Meals (FSM) is often used as a measure of deprivation for large groups of pupils (e.g. all pupils in a particular school or all pupils in a specific ethnic group).
The eighteen ethnic groups in the exclusion statistics are based on those used in the Census. One of the reasons statisticians may want to identify a particular group is because they are more disadvantaged than other groups with which they might otherwise be included. This could explain why these groups are both small and disadvantaged.
At the time of the 2022/23 exclusion figures, 76% of state school pupils were not eligible for FSM. We can expect this to cover a wide range of incomes and wealth.
There is another method of identifying disadvantage in school statistics. Statisticians also use data which identify pupils from poorer neighbourhoods by postcode. However, these data have not yet been published for the 2022/23 exclusion figures. Also, I am sceptical whether these data will cast any light on the issue. Partly this is because I suspect that the numbers in these figures will be very small. More importantly, I would assume that the relationship between postcodes and disadvantage may vary between different ethnic minorities because of the different geographical spread of ethnic minority groups.