Over the past few months, I’ve noticed that many dubious statistics about exclusions from schools in England first appeared in a single report. This report, Making the Difference, was published by the IPPR1 think tank in 2017. In Part 1, I looked at the claims made about the risk factors for exclusion, and the impact of exclusions, in the report’s “60-second summary”.
I found that while some of the claims were broadly accurate about what risk factors and outcomes were correlated with exclusions, almost all the numbers were incorrect. Even where the claims in the summary were probably accurate, the parts of the main report they were based on often had incorrect numbers or poor evidence.
Andrew Old's Education Battleground is a reader-supported publication. To receive new posts and support my work, consider becoming a free or paid subscriber.
In this post, I will scrutinise some of the other claims made in the summary.
The stupidest statistic in the debate about exclusions
The summary claims:
Every cohort of permanently excluded pupils will go on to cost the state an extra £2.1 billion in education, health, benefits and criminal justice costs.
This is obviously bonkers, given that we have no good evidence that exclusions are the cause of any “health, benefits and criminal justice costs”. The source of the statistic is the IPPR’s own “research” which is less than transparent. According to the main report (page 22):2
IPPR research estimates that the cost of exclusion is around £370,000 per young person in lifetime education, benefits, healthcare and criminal justice costs.
This calculation reflects the costs of: education in the alternative provision sector; lost taxation from lower future earnings; associated benefits payments (excluding housing); higher likelihood of entry into the criminal justice system; higher likelihood of social security involvement; and increased average healthcare costs. Using the official figure of 6,685 children permanently excluded from school last year, this amounts to £2.1 billion for the cohort….
….CONCLUSIONS
Excluded pupils are likely to suffer long-term mental health problems, fail to achieve basic levels of literacy and numeracy, struggle to gain qualifications needed to access work, to be long-term unemployed, and to be repeatedly involved in crime.
As well as an incalculable personal cost, this has a huge societal cost. The cost to the state of failing each pupil is an estimated £370,000 in additional education, benefits, healthcare and criminal justice costs across a lifetime.
We calculate on official estimations of numbers of exclusion, that this is a £2.1 billion cost for every year’s cohort of permanently excluded young people. Yet, given that the full extent of exclusion greatly exceeds official figures, the true cost of exclusion is likely to be many multiples of this estimate.
I have addressed this claim before in a blog post where I quoted the above text, and observed:
…that’s it. No details of how the calculation was made. No accompanying technical report. They simply assumed that exclusions cause bad outcomes for excluded pupils, and made estimates for the extent and costs of those outcomes, which (apart from the total) they did not share…
The statistics for the cost of exclusion have no working out (other than multiplying £370,000 by the number of excluded pupils to get £2.1 billion) but is based on an unproven assumption that not excluding will somehow magically cure the criminality, poor health and expected low incomes of the excluded. This has no credibility at all.
And, of course, the additional assumption has been made that not permanently excluding has no costs. This seems unreasonable when you look at stories, like this and this, where teachers who faced horrific ordeals, due to their schools failing to keep them safe from dangerous pupils, have been paid hundreds of thousands of pounds in compensation. And that’s not considering the direct costs – in terms of learning, human suffering and staff retention – of not keeping kids safe and their lessons undisrupted.
Misreading a survey about mental ill health
According to the summary:
…a lack of workforce development in schools compounds the challenge students face. Half of school leaders say their teachers cannot recognise mental ill health, and three in four say they cannot refer effectively to external services.
In a way, I think it would be a good thing to admit that teachers cannot be expected to accurately assess the mental health of their pupils. However, it seems a bit pointless to ask school leaders if their teachers can recognise mental ill health. The obvious answer would be: “it depends”. Few teachers would claim they have expertise in this area, but few would deny that there might be cases where it’s obvious.
I decided it was worth checking what the evidence was for these claims about what school leaders had said. When I tracked this claim back to the main report (page 27), I found that it came from an NFER research report based on a survey. However, something doesn’t add up when you look at what that NFER survey found.
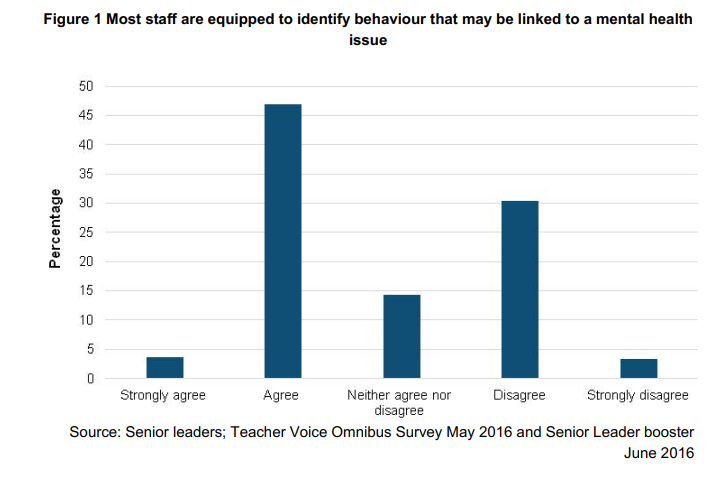
Senior leaders were asked whether they believed most staff at their school were equipped to identify behaviour that may be linked to a mental health issue. As shown in Figure 1, more than half (51 per cent) reported that they ‘strongly agree’ 19 or ‘agree’ that most staff were equipped to identify such behaviour, and a third (33 per cent) ‘disagree’ or ‘strongly disagree’.
Fourteen per cent of senior leaders neither agreed nor disagreed. The responses from senior leaders in primary schools and secondary schools were similar.
Nearly three-fifths of classroom teachers (57 per cent) agreed or strongly agreed that they feel equipped to identify behaviour that may be linked to a mental health issue. Nearly a quarter (23 per cent) disagreed or strongly disagreed and a fifth neither agreed nor disagreed. The responses from teachers in primary and secondary schools were similar.
More than half (55 per cent) of the senior leaders responded either ‘agree’ or ‘strongly agree’ to the statement that most staff knew how to help students with mental health issues to access support offered in school and less than a third (30 per cent) reported either ‘disagree’ or ‘strongly disagree’. Nearly three-fifths of classroom teachers (59 per cent) reported ‘agree’ or ‘strongly agree’ that they knew how to help pupils with mental health issues access support offered by their school or college. A larger proportion of secondary classroom teachers (62 per cent) compared to primary classroom teachers (54 per cent) reported ‘agree’ or ‘strongly agree’. Slightly less than a quarter of classroom teachers (22 per cent) responded either ‘disagree’ or ‘strongly disagree’
Senior leaders and classroom teachers alike were more likely to disagree than to agree that most staff in their school knew how to help students with mental health issues access specialist support outside of school. Around half of the senior leaders (51 per cent) reported either ‘disagree’ or ‘strongly disagree’, whilst around a quarter (27 per cent) agreed or strongly agreed. Similarly, 45 per cent of classroom teachers reported ‘disagree’ or ‘strongly disagree’ and around a third (32 per cent) responded ‘agree’ or ‘strongly agree’.
This is different to the claims in the IPPR report. It seems that the authors of the IPPR report counted those who say they “neither agree nor disagree” with a statement as if they had disagreed.
An inaccurate prediction
The belief that mental health is important to exclusions also leads the authors to make a baseless prediction:
As mental ill health in young people rises, and more children are subject to interaction with social care services each year, more vulnerable children spill into the alternative provision (AP) sector.
We now know what actually happened to the number of pupils in AP:
While the authors of the IPPR cannot be blamed for failing to predict the pandemic, I think it’s clear that AP numbers are not easily predicted from trends in mental health.
Supply staff, unqualified staff and leadership vacancies
According to the summary:
New data analysis shows once a child is excluded, they are twice as likely to be taught by an unqualified teacher and twice as likely to have a supply teacher. Meanwhile, a leadership recruitment crisis in schools for excluded pupils has seen leader vacancies double between 2011 and 2016.
These claims are not what the statistics they are based on actually show.
“they are twice as likely to be taught by an unqualified teacher”. According to the main report (page 32), the cited statistic showed that the proportion of unqualified teachers in special schools (which includes AP and PRUs) is twice as high as in secondary schools. Special school pupils are a different population to excluded pupils (even though there is some overlap). The proportion of unqualified teachers is not the “likelihood of being taught by an unqualified teacher” which will depend on how many teachers a pupil has.
“twice as likely to have a supply teacher”. The main report (page 31) reveals that this is based on the proportion of temporarily-filled posts in “state funded Special/PRU/AP”. Again, this is a different population and a different statistic.
“leadership recruitment crisis in schools for excluded pupils”. Again, this is based on the “state funded Special/PRU/AP” which is a different population. The claim that “leader vacancies [doubled] between 2011 and 2016” appears to be based on figures showing that 0.2% of positions in the category “Head/Deputy/Assistant head” in the sector were vacant in 2011 and 0.5% were vacant in November 2016. The 2016 figure is more than twice as high as in 2011, but rather than indicating a crisis, it seems to reflect tiny figures that vary each year and have been overly rounded. In 2016, the 0.5% figure represented somewhere between 15 and 24 vacancies.3 This was non-unusually high. Nor was it the result of a consistent increase since 2011. This figure was also 0.5% in 2013, and because of the rounding, we have no idea whether this was higher or lower than in 2016.
After all these problems with the summary, you might be wondering how long it is
All of the inaccuracies I have identified in these two posts have been found after looking at the “60 Second Summary” of the IPPR’s main report. This summary lasts two pages. And there are still statistics in there that I did not bother to check. This is a spectacular intensity of inaccurate or poorly sourced information. Of course, this wouldn’t matter if everyone else involved in education had noticed the report was worthless and ignored it.
In Part 3, I will look at how widely disseminated some of the most absurd claims I have mentioned were, and how much the report influenced the policy debate.